
In a recent startup conference, I asked a founder if they had implemented analytics before their launch. The answer (and it's a popular one!) was, "We wanted to launch first and add the analytics stack later."
I would pose a question to them: how could you launch without analytics?
What if I told you that your Startup is just a hypothesis; Your product, an experiment; and Analytics, the data that validates the hypothesis. You claim that your product aims to solve an existing problem. Does the problem exist? Is your product the correct solution to this problem? Analytics can answer all these questions objectively, with raw numbers.
Founders passionately believe in what they are building. Unfortunately, around 90% of the time, they end up making something not required by the market, which presents an enigma. There is a gap that exists between reality and delusion amongst many founders. This reality-delusion gap engulfs a founder and causes them to go on for way too long and burn a lot of time and money. They either end up pursuing a problem that doesn't exist or fail to develop an effective solution to a real problem.
Analytics has the effect of collapsing this reality-delusion gap by opening up reality to the Founder. You will be able to see if your product is helping your users and if they return week after week.
The Anatomy of a Metric
So how do we go about doing this? Before we delve into the three must-have metrics for launch, it would be beneficial to understand how you compose a metric.
The Anatomy of a Metric.
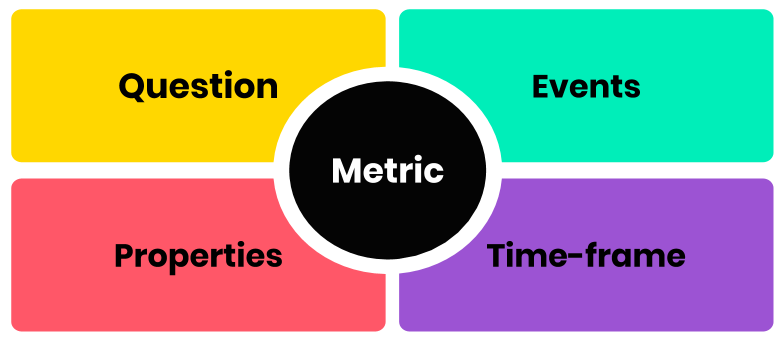
A useful metric will always answer a question and be actionable. The answer to this question should give you the best picture of how well your product launch is going. For example, How well am I converting users through my signup flow?
You then determine what customer actions or events you should track to answer that question. Events are any actions performed by the user in your product. From the case above, we would want to trace two Events; User Visiting a Page and User signing up.
An event that occurs has a lot of properties associated with it: The customer performing it, their age, or their Country, for instance. For the case above, you might want to track the traffic source and Country. You would then be able to filter your Metric by useful properties and get a more in-depth insight into your growth strategy.
After that, you would pick the best time-frame that suits the frequency of the event you want to track, such as measuring daily, weekly, or monthly signups. Ask yourself how often those events occur, and it will give you a good idea of the time-frame.
With the events, properties, and time-frame, you can now quickly determine appropriate metrics. For the above, the Metric could be "Signups/week," "Signups/day," or "% converted/day." Thanks to the properties, you would also be able to filter that Metric down to "Signups from Bahrain/week" or "% converted from our Facebook ads/day."
The Growth Metric Framework
So what do you measure? How many metrics do you need?
To get started, we need to understand what drives Product growth and, ultimately, success.
In a recent training session, I laid out the foundation of a successful analytics implementation—the growth funnel. It is an abridged version of 500 startup's Dave Mcclure's Pirate Metrics framework.

The Growth Funnel
I commit this to memory, and so should you! It has helped me countless times, planning how to track products and establish a practical, simple data-driven growth strategy at launch.
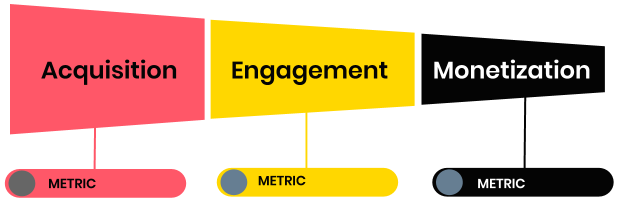
Acquisition is about pulling in customers to try your product. It answers questions such as: how many signups do you have this month versus last? Or How effective is my onboarding strategy?
Engagement is about how well your customers receive your product. It answers questions such as: how many users return week after week or month after month?
Monetization is about how well you are driving engaged customers to bring income to your company. It answers the question of how much revenue you have this month vs. last.
One phase cannot bring success, on its own, without the others. If you were to monitor and improve each stage of the funnel, you would be on your way to a successful product launch.
So there we have it! We attach Metrics to each phase of the growth funnel. These metrics will be your guiding stars to measure your product's performance. The goal is to have just enough analytics to monitor your launch without being overwhelmed with data and implementation.
The Three "Growth" Metrics
Your Acquisition metric will let you know how well your marketing efforts perform. Are your Facebook ads helping in driving customer signups?
Your Engagement Metric enables you to know if your product has a product-market fit! Are users coming back week after week, are they addicted to your product?
Your Monetization Metric will be the culmination of all your efforts; how much monthly/weekly/daily revenue do you have? This Metric is by far the most favored statistic amongst your investors and Venture Capitalists.
Metric #1: Acquisition Metric
No doubt, a big part of your launch will be engaging in activities to drive customers to your product, by paid advertisement, social media, offering samples or trials, etc. It is essential to be able to track the effectiveness of such campaigns. Your ultimate goal here is user conversion, getting visitors to signup!
Acquisition for your product can be either the signup, initial use, or even a request for quote depending on your specific product or service that you are offering to the market.
Taking Netflix, for example, they want to measure the effectiveness of their marketing channels in onboarding users. The main event to track would be User Signups. To get a deeper understanding of their customers, they would probably record Properties, such as the source and Country of the signup. Assuming they realized that signups occur mostly on weekends, they decide to go for a monthly time-frame to average out several weeks and get a more comparable or actionable metric.
Netflix Acquisition Metric. Signups per month.
Metric #2: Engagement Metric
Getting those customers through the door is not enough!
Our products aim to solve a problem. Engagement is about measuring how frequently our customers are likely to face this problem in their daily lives. In other words, how often they need our product. Engagement, and its metrics, are the analytics answer to whether you have a product-market fit!
If you take anything from this article, this section is the most important for startup launches. Without engagement, your advertising and marketing expenses are like burning money as the users who come to your app or website will soon leave! By far, engagement holds the number one spot on reasons why startups fail.
You first need to brainstorm what engagement means for your product. It defines the actions or events the customer would take to be considered engaged. I usually tell founders to start from the problem their product is trying to solve and look at the customers' actions that address it.
For Netflix, its when a person watches a video. For Slack, a team communication app, it's when a person communicates with their team. For Coursera, an online education platform, its when a person engages in online education. For Candy Crush, a mobile game, its when a person plays the game!
In almost all cases, Retention should be the Metric of choice for tracking engagement. Yes, it's that good! Retention is the rate of users your Startup retains after a given period following their signup. If your 8-week Retention is 40%, you would expect that only 40% of your users would remain engaged in your product 8 weeks after they sign up, with the remaining 60% being inactive. Having your Retention metric would allow you to strategize and iterate your product for higher engagement.
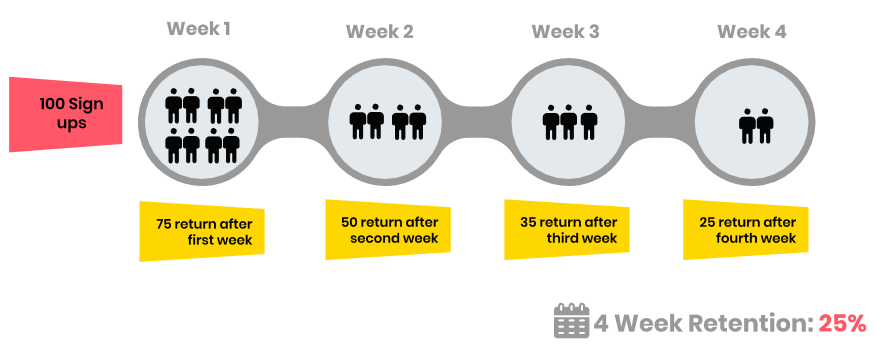
The retention metric is a bit tricky, in that we would have to track users on a rolling basis. For instance, in the first week of February of this year, we had 100 signups. We monitor those 100 users across several weeks and see how many are still returning or "engaging" with our product week-after-week. We then take the number of customers in the second week of February, and we perform the same test. We keep doing that for subsequent weeks, on a rolling basis to measure the ratio of users who stick around.
For our Netflix example, we would need to track two events. The 'user-signed up' event would indicate the starting point when we measure a user's engagement. The 'user-watched video' event would be the engagement event. An appropriate time-frame for 'user-watched video' would be weekly. The assumption here is that the average user watches a video on their weekends. (your mileage may vary!)
Netflix Engagement Metric. Weekly Retention. How often do users come back and watch a video?
Metric #3: Monetization Metric
The person who doesn't know where his next dollar is coming from usually doesn't know where his last dollar went.
The customers are coming through your door, and you figure out, hey, they are pretty addicted to your product! Now what? Just as it is essential to attract and retain your customers, it is also vital to track and understand how your revenue is acquired.
As a Subscription-based company, you would look at monthly recurring revenue. For direct sales or commission-based companies, you would look at monthly or quarterly income. For enterprise sales, you might want to look at monthly approved contract values.
For Netflix, they are charging a monthly subscription. Their ultimate question is whether their monthly revenue is increasing month after month.
To accurately track this monthly revenue, they would need to add the subscribed users' monthly subscriptions. So whenever a user upgrades their subscription (an event!), they add their monthly subscription to their total monthly revenue. They might also want to add properties such as Country, the package name, amount, etc. to get a more fine-tuned metric that can precisely ascertain the sources and motivations behind their monthly revenue.
Netflix Monetization Metric. Monthly Recurring Revenue (MRR).
Putting it all together
So you have decided your metrics, and are excited to have a data-driven launch! Well, the hard part is over.
Ten years ago, this was a lot harder than it is today. I remember having to deal with daily exported CSV files and clunky graphs. Today the set-up is quick and easy thanks to amazing analytics tools such as Mixpanel, Amplitude, Kissmetrics, and others.
There is a misconception amongst most founders that Google Analytics and various app store analytics tools are enough to measure product success. The truth is, those tools will only give a partial view of your growth story. Google Analytics shows how internet traffic flows to your app but does not provide useful information on actual customer behavior.
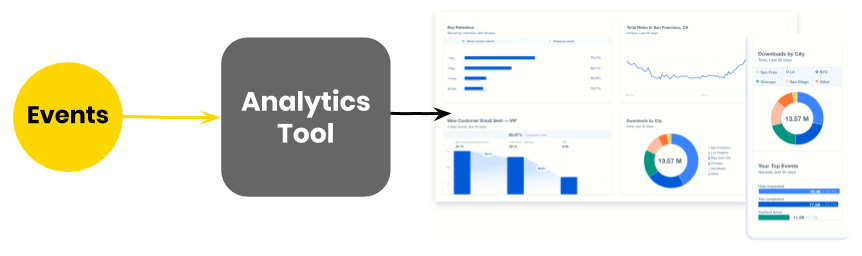
You should now have all the events you need to track for your metrics. You will find where those events occur in your product and send those events to an analytics tool.
Analytics is easy!
Implementing event-based analytics is the bane of most startups. Yes, it requires some coding, that is precisely why non-technical founders generally stray away, while technical founders set it up in a few minutes.
For our Netflix example, we have three events we would need to track to get our three metrics. Whenever a user signs up, watches a video, and upgrades their subscription, you send that event and properties to the analytics tool.
I want to stress that the amount of extra code to write is very minimal. Below is the actual JavaScript code for sending a signup event to Mixpanel for our Netflix example:
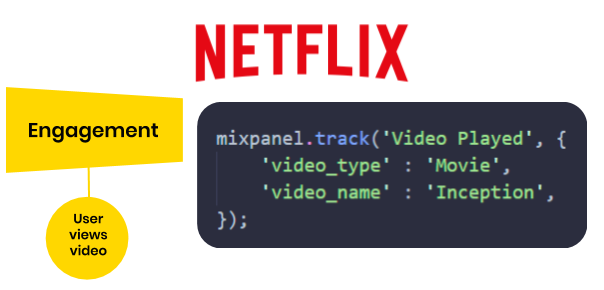
Sample JavaScript code to send a Netflix engagement event to Mixpanel
Looking at the code above, 'Video Played' is the name of the event. There are also two properties, the video type, 'Movie,' and the video name, 'Inception.' (one of my favorite movies of all time!) Ideally, whenever a user clicks on the play button on the Netflix app, we would trigger the above code to signal our Analytics tool that the event has happened.
Once your analytics tool of choice is receiving events, you would be able to configure your metrics by setting it within the analytics tool.
The next step is to put your metrics on a dashboard or TV to refer to it daily. You would use it in strategy meetings and refer to it when deciding to change and iterate parts of your product. Eventually, you will use those same numbers to convince investors and new team members about your product.
The three growth metrics give you a non-subjective story that you can easily communicate with advisers, investors, and your team.
Good luck with your data-driven launch!